
Prepare a Recurring Dashboard Report with Checkable Numbers

A recurring dashboard report should answer an agreed decision using defined measures, a named reporting period and traceable source data. Record what was refreshed, reconcile important totals, and explain missing or changed inputs before delivery. Keep the published report attached to its data cutoff so the next update can be compared fairly.
This is a proposed reporting workflow. The practice dataset and arithmetic below are invented. Financial reporting, sensitive personal information and specialist analytical advice can require controls beyond this small service.
Agree what the report is meant to change
Start with a decision: which outstanding requests need an owner this week, for example. A collection of charts doesn't become useful merely because it updates regularly. Ask the recipient which action they expect to take and what information would make that action reasonable.
Write a small measure dictionary before building the view. For each measure, define what is counted, which records qualify and which date field determines the period. “Completed work” could mean an internal status change, client acceptance or a delivered file. Choose the definition with the responsible owner; don't switch between them to produce a cleaner trend.
Identify the source owner and the expected cutoff. If a system export arrives late, decide how that will be reported. A blank input, a true zero and an unavailable value should remain distinguishable. Readers need to know whether nothing happened or whether the report cannot yet tell them.
The spreadsheet cleanup guide covers preparing an input file. This service goes further into recurring definitions, reconciliation and delivery, while keeping the underlying source intact.
Know what the source range includes
Microsoft's PivotTable overview describes worksheet data with column labels and consistent data types as suitable source material. It says refreshed PivotTables based on an Excel table include new and updated data from that table. The source definition still matters: a report cannot summarize rows it hasn't included.
Source: Microsoft's overview of PivotTables and PivotCharts. Read 2026-10-26. Confirm the actual workbook's source and filters rather than assuming a particular setup.
Record the source location, field mapping and any exclusions used for the reporting period. Check whether a newly added record is within the intended input. If different files use different labels for the same status, ask the owner to approve the mapping before merging categories.
Don't repair an unexplained mismatch by deleting awkward rows. Preserve the input and document the exception. A recurring service needs a repeatable explanation of the result, including cases that prevent the report from being finalized.
Refresh deliberately and inspect the result
Microsoft documents manual Refresh and Refresh All controls for PivotTables. Its page also describes different automatic refresh behavior across versions and sources, with availability notes. Opening a workbook should not be treated as sufficient evidence that every report input is current.
Source: Microsoft: refresh PivotTable data. Read 2026-10-26. Check refresh behavior in the workbook's actual Excel version and connection.
For the real assignment, identify which refresh action is appropriate to the workbook. Record completion or an error, then inspect a known changed record or total. If refresh fails, preserve that state and mark the output accordingly. Don't deliver an old result with a new filename that suggests a current period.
Check filters after refreshing. A correct source and successful refresh can still produce the wrong view if the report is displaying a narrower period or category than the recipient expects. Keep the relevant selections visible in the delivery note.
Check Power Query at its load destination
If the workbook uses Power Query, record a preview refresh separately from a refresh of the delivered data. Microsoft's external data refresh guide explains that refreshing inside Power Query Editor updates its local cache but does not update the query in the worksheet or Data Model. A recent preview timestamp alone cannot establish that the report is current.
For a query loaded to a worksheet, Microsoft documents selecting a cell in the query output and choosing Query > Refresh > Refresh. Identify the query and its actual load destination before choosing the relevant refresh action. Keep the original input table distinct from the worksheet containing the loaded query; they can look similar, and selecting the wrong sheet can confuse a check.
Add the query name, load destination and observed refresh result to the handover. Then inspect a known changed record in the output being delivered and confirm that the report uses it. Leave a failed or unfinished refresh unresolved. These checkpoints apply to the documented Excel Power Query workflow; a different reporting tool needs its own refresh and verification process.
Reconcile a small fictional queue
Consider a practice queue that begins a period with 12 open requests. During the period, 8 new requests arrive and 5 are completed. Under a deliberately simple definition with no reopened or removed requests, the expected closing balance is 12 + 8 - 5 = 15. These numbers are invented to demonstrate a check, not observed business performance.
If the report shows 14, pause before drawing a conclusion about productivity. Inspect the source records, period boundary and status mapping. Perhaps one record was excluded, or perhaps the starting balance used a different definition. The discrepancy is a question to resolve, not evidence that the business improved or declined.
Now change the practice scenario: one request is reopened. The simple reconciliation needs an explicit reopened category or a revised definition. Ask the owner which treatment the recurring report should use, document it and apply the same rule to future periods.
This is why a small reconciliation can be more valuable than another chart. It tests whether the report's categories fit together. It also identifies the point at which a coordinator needs a decision from the data owner instead of making a hidden adjustment.
Separate observations from explanations
Write the report note in layers. State the observed result under the agreed definition, then identify data limitations and questions that need investigation. A change after a new workflow begins doesn't by itself prove that the workflow caused it.
If the reporting period is incomplete or the source changed, say so near the affected measure. Avoid percentage comparisons built from incompatible periods. When a denominator is zero or missing, explain why a percentage isn't being reported rather than substituting a convenient number.
For context gathered from public material, the desk research brief guide explains how to keep external evidence separate from interpretation. A dashboard's internal records and a public source can inform the same decision without having the same meaning or reliability.
Check who can open the delivered dashboard
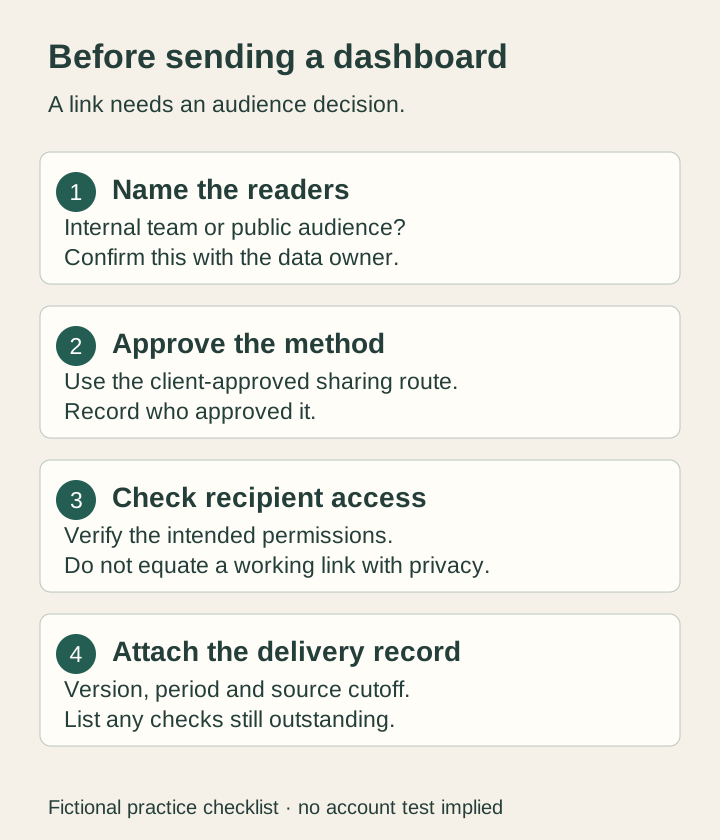
Before offering an interactive Power BI report, agree on its audience. A report for a client's internal team needs an access decision alongside the data cutoff. Record who approves the delivery method and which version is being shared.
Microsoft's Publish to web documentation says that this option makes a report available to anyone online without authentication. Its warning also covers underlying model data that the report may not show. Do not use it for confidential or proprietary material. Source checked 17 November 2026.
For an internal handover, ask the owner to choose an approved sharing method and confirm its permissions in the receiving environment. Sending a public report's link only to named people does not restrict its audience. A successful link opening is evidence of availability; the agreed access check must also establish who is allowed to open it.
Use the fictional request queue to write a delivery note with the intended readers, reporting period, data cutoff, approved method and checks still outstanding. If access cannot be confirmed, keep the handover pending.
Freeze the delivered version and plan the next update
Deliver the accepted report with its period, data cutoff and unresolved exceptions. Preserve the working source reference and a record of the checks performed, under the owner's storage rules. A later refresh should create a clearly identified update rather than quietly replacing the version the recipient approved.
Ask the recipient to check a representative measure against the agreed definition before accepting the recurring format. Adjust the dictionary when a real ambiguity appears. If an old comparison must be restated, label the change and retain the earlier result so the difference can be understood.
Estimate the service around obtaining inputs, resolving exceptions and reviewing output as well as building the first chart. Don't promise automatic delivery when another person's export or approval is required. The remote services guide can help frame a bounded offer without predicting a payment date or net income.
Begin with a fictional dataset and a written reconciliation. A useful sample lets a reader trace a reported value back to its definition and identify exactly what would keep the report pending.